Wednesday 30 October 2013

Using the Raspberry Pi Wobbulator to test the G6LBQ Multiband Bandpass Filter

Finally, I decided to use the Raspberry Pi Wobbulator to test the frequency response characteristics of the G6LBQ multiband bandpass filter which I had built as part of a homebrew transceiver project. The fully assembled filter board is shown below (it is part of a Bitx Transceiver project I'm working on) and it covers the whole HF spectrum in 9 bands, all the way from the 160m band (1.8  - 2.0 Mhz) to the 10m band (28 - 30 MHz). Each bandpass filter uses a 3rd order Butterworth design and built using the "redeveloped" component kit from Spectrum Communications. Please note that there is a revised and improved version of the G6LBQ multiband bandpass filter due out very shortly - see the DX KITS web site for details.


Prior to testing with the Raspberry Pi Wobbulator, each bandpasss filter was adjusted to give peak responses at the following frequencies on each band by connecting an RF signal generator to the input of the filter and measuring the output on an Oscillioscope (which is the "normal" way of adjusting such filters).
  • 160m band - adjusted for peak response at 1.9 MHz
  • 80m band - adjusted for peak response at 3.6 MHz
  • 40m band - adjusted for peak response at 7.1 MHz
  • 30m band - adjusted for peak response at 10.1 MHz
  • 20m band - adjusted for peak response at 14.2 MHz
  • 17m band - adjusted for peak response at 18.1 MHz
  • 15m band - adjusted for peak response at 21.2 MHz
  • 12m band - adjusted for peak response at 24.9 MHz
  • 10m band - adjusted for peak response at 29.0 MHz
A screen shot of the results obtained from testing the 160m bandpass filter is shown below. Channel 1 on the ADC Pi module was used and the PGA gain was set to the maximum value of 8x. The wobbulator performed a sweep from 1.8 MHz to 2.0 MHz in increments of 1000 Hz (1 KHz) and the response shows a double peak centered around 1.9 MHz.


A screenshot of the results obtained from testing the 80m bandpass filter is shown below, using channel 1 on the ADC Pi module with PGA gain of 8x. The wobbulator performed a sweep from 3 MHz to 4 MHz in increments of 10 KHz, and the response shows a nice peak around 3.6 MHz.


A screenshot of the results obtained from testing the 40m bandpass filter is shown below, using channel 1 on the ADC Pi module with PGA gain of 8x. The wobbulator performed a sweep from 6.6 MHz to 7.6 MHz in increments of 10 KHz. Although the response of the filter peaks around 7.1 MHz the response curve would suggest that the various filter elements are not well aligned.


A screenshot of the results obtained from testing the 30m bandpass filter is shown below, using channel 1 on the ADC Pi module with PGA gain of 8x. The wobbulator performed a sweep from 9 MHz to 11 MHz in increments of 10 KHz. The response shows a peak around 10.1 MHz, but the response has a "shoulder" around 9.8 MHz which may indicate that the filter is not perfectly aligned.


A screenshot of the results obtained from testing the 20m bandpass filter is shown below, using channel 1 on the ADC Pi module with PGA gain of 8x. The wobbulator performed a sweep from 13 MHz to 15 MHz in increments of 10 KHz. The response shows a peak around 14.2 MHz, and the useable bandwith would be between 14.0 MHz and 14.4 MHz, but again the response has a distinct "shoulder" on the lower side which may indicate that the filter is not well aligned.


A screenshot of the results obtained from testing the 17m bandpass filter is shown below, using channel 1 on the ADC Pi module with PGA gain of 8x. The wobbulator performed a sweep from 17.1 MHz to 19.1 MHz in increments of 10 KHz. The response shows a peak around 18.3 MHz, which is too high, and there is a "shoulder" around 17.9 MHz.


A screenshot of the results obtained from testing the 15m bandpass filter is shown below, using channel 1 on the ADC Pi module with PGA gain of 8x. The wobbulator performed a sweep from 20 MHz to 22 MHz in increments of 10 KHz. The response shows a peak around 21.4 MHz, which is too high side for this band, and again the response if not symmetrical either side of the peak indicating possible misalignment.


A screenshot of the results obtained from testing the 12m bandpass filter is shown below, using channel 1 on the ADC Pi module with PGA gain of 8x. The wobbulator performed a sweep from 24.2 MHz to 26.2 MHz in increments of 100 KHz. The response shows a broad peak around 25.2 MHz, which is too high for this band.


A screenshot of the results obtained from testing the 10m bandpass filter is shown below, using channel 1 on the ADC Pi module with PGA gain of 8x. The wobbulator performed a sweep from 27 MHz to 31 MHz in increments of 10 KHz. The response has a peak around 29 MHz, and a secondary peak around 28 MHz, indicating possible misalignment of the filter.


Clearly using the Raspberry Pi Wobbulator to test the multiband bandpass filter provided much more information than could be obtained by simply peaking the response of the filter at a single frequency. The Raspberry Pi Wobbulator performed extremely well across the whole HF spectrum and produced some very useful results, however some care is required when specifying frequency sweep parameters - if a large sweep is specified with a small increment, the sweep can take a considerable amount of time to complete.

For the radio amateur or electronic hobbyist, the Raspberry Pi Wobbulator provides a cost effective alternative to a “conventional” Wobbulator (or Sweep Generator, which also requires an Oscilloscope), or a Spectrum Analyser (which is beyond beyond the budget of most hobby users) for examining the frequency response characteristics of a circuit.

Having shown that the Raspberry Pi Wobbulator is a viable proposition, I hope to go on to develop it into a single plugin module for the Raspberry Pi. You can follow the progress of this project here and I've also setup a Yahoo Group here for discussion of all things Raspberry Pi Wobbulator related

Also please note that I have just received a small number of the DDS modules from the manufacturer in China - if you would like one please email me.

Monday 28 October 2013

Using the Raspberry Pi Wobbulator to test a RF Crystal and an IF Transformer

First of all I used the Raspberry Pi Wobbulator to examine the frequency response characteristics of an RF Crystal. One side of the crystal was connected to the output from the DDS module and the other side was connected to the input to the Buffer Amplifier / Detector. The outer metal casing of the crystal was grounded using a crocodile clip, and the crystal was tested with and without a small (10pF) capacitance in parallel. This capacitance was added simply by connecting the capacitor across the crystal using a pair of miniature crocodile clips.


 The nominal frequency of the crystal being tested was 14.070 MHz so the start frequency for the sweep was set to 14.060 MHz and the stop frequency for the sweep was set to 14.080 MHz and the increment was set to 100 Hz. Channel 2 was selected on the ADC Pi module and the PGA gain was set to 1x. The results are shown in the following screenshot.


The blue plot shows the response of the crystal on its own and shows the resonant frequency to be just above 14072000 Hz. The red plot is the response of the crystal with a 10pF capacitor connected in parallel across the crystal, and shows the resonant frequency to be a little over 14068000 Hz. This demonstrates nicely how the resonant frequency of the crystal can be “pulled” by adding a small capacitance in parallel.

Then I decided to use the Raspberry Pi Wobbulator to test the frequency response characteristics of a small IF transformer coil (TOKO Part RMC15002A - see photo below). This is a 455 kHz RF transformer and is typical of those used in the IF stages of many HF receivers. Proper alignment of the IF stages of a Superhet receiver is critical for good performance and it was for this task that a "conventional" Wobbulator was typically used, so I considered this to be an important test for the Raspberry Pi Wobbulator.


The frequency sweep was set to start at 200 KHz and finish at 700 KHz, with an increment of 1 KHz. Channel 2 was selected on the ADC Pi module and the PGA gain was set to 1x. The results are shown in the screenshot below.


The results show the response to peak at just over 450 kHz as would be expected. The results from this test and from testing the RF Crystal both demonstrate the effectiveness of the Raspberry Pi Wobbulator for measuring the frequency response characteristics of a component.

In my next post I'll discuss how I used the Raspberry Pi Wobbulator to test a multiband bandpass filter. 


Saturday 26 October 2013

Developing the Raspberry Pi Wobbulator Software

The Raspberry Pi Wobbulator software was all written in Python 3, which seems to be the programming language of choice as far as the Raspberry Pi community is concerned, perhaps because it comes ready to use with the Raspbian "Wheezy" operating system. The software was written using IDLE 3 (the Python 3 Integrated Development Environment supplied with  the Raspbian "Wheezy" operating system). To launch IDLE 3, double click on the IDLE 3 on the LXDE desktop. This will open the "Python Shell" window as shown below.


From here you can enter commands directly for immediate execution, or you can open a Python file to work on, or create a new file by clicking on the "File" menu and choosing the appropriate action.


The Graphical User Interface (GUI) for the Raspberry Pi Wobbulator was designed and programmed using Tkinter - the GUI programming toolkit supplied with Python. Although it is not a WYSIWYG GUI design tool, Tkinter is the most commonly used GUI toolkit, and can be used to create simple GUI’s fairly easily. For details of the Tkinter package and links to Tkinter documentation, please visit the Python website. There's also an excellent online Tkinter reference written by John W. Shipman if you're interested in learning how to use Tkinter. A screenshot of the Raspberry Pi Wobbulator GUI is shown below.


The user can enter parameters for the frequency sweep along the bottom of the screen. The various buttons down the right hand side of the main window allow the user to select the input channel (Ch) on the ADC Pi module, the gain for the PGA, and the line colour used to plot the response curve. The “RUN” button initiates the frequency sweep, and the response curve of the circuit under test is plotted in the “results area” (the large cyan coloured area taking up most of the main window). The X-axis on the results area represents frequency from the “start frequency” on the left to the “stop frequency” on the right and the Y-axis represents the magnitude of the signal passing through the circuit under test, as measured by the ADC Pi module.
The user can choose whether or not to display a grid over the results area, and the “CLS” button clears the results area of any previous plots.

Event handlers were written for the various GUI “widgets” and the test code for the DDS module and ADC module was modified and incorporated into the program to implement the low level communication between the hardware modules and the Raspberry Pi’s GPIO header.

The source code for the Raspberry Pi Wobbulator can be downloaded from Github, or you can use the "git clone" command to download a copy of the repository on to your Raspberry Pi. To do this, type the following at the command line prompt and press Enter:

pi@raspberrypi ~ $ git clone https://github.com/mi0iou/RPi_Wobbulator.git_

When you execute this command, a new folder called "RPi_Wobbulator" will be created under "/home/pi" and the source code (and other files) will be downloaded and saved in this folder. You will see the following messages in the terminal window (or at the command line prompt) as this takes place.


Now if you launch IDLE 3 you can open the file "rpi_wobbulator.py" and run it by selecting "Run->RunModule" or by pressing "F5".


In my next posts I'll discuss some of the results obtained when the Raspberry Pi Wobbulator was used to examine the frequency response characteristics of an RF crystal, an IF transformer, and a multiband bandpass filter.

Thursday 24 October 2013

Adding an Envelope Detector to convert an RF input to a DC output

I connected the ADC Pi module to the GPIO header and stacked the DDS module on top. PCB support spacers were used to hold the modules together and to take the strain off the GPIO pins.


And here's how it looks from the other side...


All that was left to do was to use a simple envelope detector to convert the RF coming out on the circuit under test into a DC voltage that could be measured by the ADC Pi module - time for a little bit of theory...
A simple envelope detector is shown above. It consists of only three components - a diode, a capacitor and a resistor. An RF signal (Vi) is fed into the detector and a DC signal (Vo) comes out the other end. The RF input (blue line) and DC output (red line) signals are plotted below.
When I tried using a simple envelope detector I discovered that I was getting little or no signal out of the envelope detector. So much for the theory! I measured the peak RF voltage coming out of the circuit under test I found it to be around 0.2Volts (200mV) - this was the cause of the problem! Time for some more theory...

With reference to the graph above, a diode needs a certain level of forward voltage "Vd" to "turn it on". For a Silicon diode this voltage is about 0.7 Volts and for a Germanium this voltage is around 0.25 Volts (250 mV), which is around the same level as (or greater than) the peak RF signal voltage I was trying to detect. Therefore the RF signal I was trying to detect and measure was insufficient to drive the simple envelope detector.

The solution was to use a buffer amplifier with a high input impedance and a biased detector stage to convert of the RF signals to a DC voltage. A design by Rodney Byne for the front end of a Wideband RF Millivoltmeter was adopted and modified for use with the RPi Wobbulator. The circuit diagram is shown below:

The circuit uses a JFET transistor in “source follower” configuration, which has a gain of less than 1, but has a very high input impedance, therefore minimising the loading on the circuit under test. Diodes D1 and D2 are both Schottky type 1N5711 which have good RF bandwidth. With no RF input, VR1 was adjusted for a quiescent bias voltage of about 0.25 V (250mV). This seemed to be a good compromise between quiescent power consumption and linear performance when dealing with small RF signals.

The Buffer Amp / Detector was constructed on a prototype board and housed in a diecast aluminium box. A PP3 battery was used to power the circuit. The completed Buffer Amp / Detector is shown below.


The Buffer Amplifier / Detector was tested at various frequencies and at various input levels, and the DC output (minus the quiescent bias voltage) was found to be approximately equal to the peak voltage of the RF signal applied to the input. In other words, when a 0.2 Volt (200mV) peak RF signal was applied to the input of the Buffer Amplifier / Detector, the DC output from the Buffer Amplifier / Detector was approximately 0.2 Volts (200mV), plus the the quiescent bias voltage. This is well within the measurement capabilities of the ADC Pi module. Happy days!

So that about wraps it up for the hardware side of the Raspberry Pi Wobbulator. In my next post I'll discuss the development of the Raspberry Pi Wobbulator software.

Tuesday 22 October 2013

Measuring DC voltages on the Raspberry Pi using the ADC Pi module

The Raspberry Pi does not have a built in analogue to digital converter (ADC) so a suitable “external” ADC module had to be found. I chose the ADC Pi module from Abelectronics because of its multiple 18 bit input channels and its i2c interface. It also had the advantage of having a “stackable” design so that once connected to the Raspberry Pi’s GPIO header, it allowed other modules to be stacked on top.

Although this post deals with how to use ADC Pi module in the context of the Raspberry Pi Wobbulator, the information contained here is applicable to ANY situation where you want to use the Raspberry Pi to measure a DC voltage (e.g. analogue sensors like LDR's, thermistors etc). The ADC Pi module is extremely versatile.

All 8 input channels on the ADC Pi  module have a built-in potential divider giving an effective input voltage range of approximately 0 to 5V DC. However considering the low level output of the DDS module, I decided to remove the potential divider on Channel 1 and connect the input directly to the ADC chip, thus reducing the input voltage range to approximately 0 to 2V DC. Some right angled PCB pins were also soldered to the input terminals on the ADC Pi module to provide easy connection of “flying leads”.


In the photo above the input pins that I added are on the left and the pins on the right are the “address select” pins for the onboard ADC chip (but you really don't need to worry these - just leave the jumpers where they are). The modified input to Channel 1 can clearly be seen in the above photo - apologies for the crude soldering - I have since learned how to solder surface mount components, and bought a fine tipped iron...

The ADC Pi module has an onboard programmable gain amplifier (PGA) for each input channel with a user selectable gain of 1x, 2x, 4x and 8x, effectively increasing the sensitivity of the input channels by a factor of up to 8. Thus the input voltage range of Channel 1 will be approximately 0 to 250mV DC if the maximum gain is selected, which is of the same order of magnitude as the peak output from the DDS module. Abelectronics provide some sample Python software for communicating with and controlling the ADC Pi module. This software is available on GitHub and gives examples of how to take readings from the ADC Pi module and how to specify the input channel and select the gain of the PGA. The ADC Pi module uses I2C protocol to communicate with the Raspberry Pi, and this uses GPIO pins 3 and 5 (GPIO2 and GPIO3 on the Raspberry Pi Rev 2 board). However, I2C is not enabled by default on the Raspberry Pi, so there are a few preparatory tasks you need to perform before you can connect and use the ADC Pi module:

Open the file “/etc/modprobe.d/raspi-blacklist.conf” in Leafpad, go to the end of the file and "comment out" the last line by inserting a ‘#’ at the start of the line so that it looks like as shown below. Then save and close the file but please note that you will need root privileges to do so.


Open the file “/etc/modules” in Leafpad and add the line "i2c-dev" to the end of the file so that it looks like as shown below. Then save and close the file.


Now you need to install the “i2c-tools” package. Entering the following at the command prompt and press Enter:

pi@raspberrypi ~ $ sudo apt-get install i2c-tools_

Add your user name to the i2c group by entering the following at the command prompt (assuming your user name is “pi”) and pressing  Enter:

pi@raspberrypi ~ $ sudo adduser pi i2c_

Now it's time to power down your Raspberry Pi and plug the ADC Pi module into the GPIO header.

After you reboot your Raspberry Pi, enter the following at the command line prompt and press  Enter:

pi@raspberrypi ~ $ i2cdetect -y 1_

This should detect the presence of the ADC Pi module and display the address of the i2c bus as shown below.


The ADC Pi module uses the Quick2Wire library to allow easy access to the I2C port from Python 3. You need to download and install the Quick2Wire library, but first you need to download and install Setuptools.

Download the most up-to-date version of Setuptools (currently v1.1.6) from the Python website. Extract the “.tar.gz” package, go to the folder called “/setuptools-1.1.6” and enter the following at the command line prompt and press Enter:

.../setuptools-1.1.6 $ sudo python3 ez_setup.py_

Now download the Quick2Wire Python API package from GitHub. Extract the ".zip" file, go to the folder called “/quick2wire-python-api-master” and enter the following at the command line prompt and press Enter:

.../quick2wire-python-api-master $ sudo python3 setup.py install_

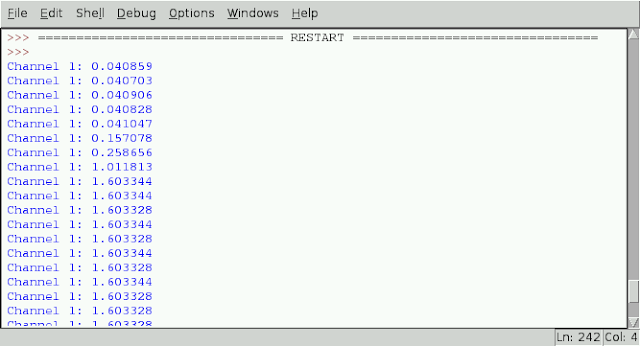
Download the "adcpiv2" sample code from GitHub. Launch IDLE3 and open the file "adcpiv2.py" and run it by selecting "Run->Run Module (or by pressing "F5"). The program continually takes readings from channel 1 on the ADC Pi module and displays the results on the Python Shell window. The results shown in the screenshot below were obtained by connecting a “AA” battery to the input of channel 1 on the ADC Pi module while the program was running.


 Congratulations! You've just made the world's most complex battery tester! You can stop the program running by pressing "Ctrl + C" when the Python Shell window is active.

So now we have a Raspberry Pi capable of generating an RF signal (see my previous post) and measuring an analogue DC signal. The final part of hardware required for the Raspberry Pi Wobbulator is some sort of detector to convert the RF coming out of the circuit under test into an analogue DC signal. That will be the subject of my next post.


Saturday 19 October 2013

Connecting the DDS Module to the Raspberry Pi to make a simple RF Signal Generator

The DDS module used to generate the RF signal for the Raspberry Pi Wobbulator is based on the AD9850 frequency synthesizer chip and is available from a number of suppliers on eBay. There are a few variations on the design of the module but the one used in this project is shown in below (mounted on a breadboard for initial testing).


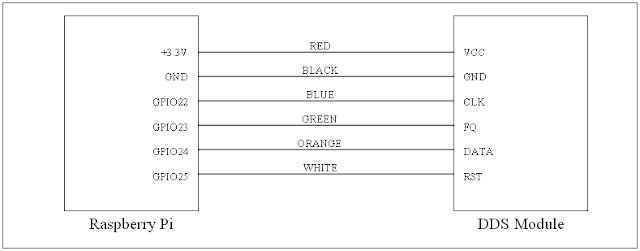
The DDS module was connected directly to the GPIO header on the Raspberry Pi using “flying leads” according to the following schematic. Note that the VCC pin on the DDS module is connected directly to the 3.3V pin on the Raspberry Pi to ensure compatibility with the 3.3V TTL logic levels used by the Raspberry Pi. 


The DDS module must be loaded with a 40 bit control word and this is achieved by programming the GPIO pins on the Raspberry Pi to communicate with the DDS module. A quick online search resulted in a simple Python program for controlling the DDS module being found on M0XPD’s “Shack Nasties” blog.


This code was rewritten to work with Python 3 (and also to use different GPIO pins) and a simple GUI designed and programmed to allow the user to choose the frequency and to start and stop the DDS module - effectively creating a simple and cheap RF signal generator, which I (rather unimaginatively) called the "RPi RF Signal Generator" (or "RPi RFSigGen" for short). A screenshot of the user interface of the RPi RFSigGen is shown below.


You can download the RPi RFSigGen Python 3 source code from GitHub as a "zip" archive. Extract all the files, launch IDLE3 (the Python 3 Integrated Development Environment bundled with the Raspbian "Wheezy" operating system), and open the file "rpi_rfsiggen.py". You should see the source code appear in a separate window. Select "Run -> Run Module" from the menu, or simply press "F5" to run the program, but note that the program must be run with "root" privileges or as “sudo”. 


The most convenient way to do this is to open the "idle3.desktop" file in Leafpad and edit it by inserting "sudo " in front of "/usr/bin/idle3" as shown below (I've highlighted the required change to make it stand out). Now every time you launch IDLE3 by double clicking on the IDLE3 icon on your LXDE desktop, you will have root privileges.


Alternatively, you can launch IDLE3 with root privileges by typing the following at the command line prompt in a terminal window and pressing Enter (but you have to do this every time you want to launch IDLE3 as sudo).

pi@raspberrypi ~ $ sudo idle3_

So, I used the RPi RFSigGen program to test the DDS module at various frequencies across the HF spectrum.There are two sine wave outputs available on the DDS module (“sin A” and “sin B”) and the waveform and spectrum of the outputs from both were examined at various frequencies up to around 30MHz. The output from “sin B” was found to be much cleaner than the output from “sin A” and largely free from harmonic distortion. The output from "sin B" in the frequency domain is shown below for 21 MHz. You can see that the output at third and fifth harmonics is very low, and this was typical of the performance of the DDS module right across the HF spectrum. Please ignore the large peak at the lower end of the spectrum (around 4MHz) – this is an spurious signal that is always present (even when there's no RF input!).


The accuracy of the frequency output from the DDS module was also checked using a frequency counter and was found to be within a few Hertz of the specified frequency and also showed little or no drifting over time. The level of output from the "sin B" output on the DDS module was found was found to be fairly constant (between 0.3V peak and 0.4V peak) over the HF spectrum, although the output was found to have a DC component. Therefore I decided to use DC blocking capacitors on the DDS output.

I decided to mount the DDS module on an Adafruit prototyping board. PCB pins were soldered to the prototyping board for the various outputs from the DDS module, and an SMA socket was mounted on the prototyping board to provide a coax output. DC blocking capacitors (1000pF or 1nF) were soldered on the "sin B" output from the DDS module to remove any DC component, but these are not visible on the photo below because they are on the underside of the prototyping board.


As before, GPIO pins 22, 23, 24, and 25 are used to control the DDS module, but the wiring is now very straight forward due to the convenient location of the the "break-out" terminals for these pins on the prototyping board.

My next post will look at how to use an ADC module with the Raspberry Pi to measure analogue voltages.


Friday 18 October 2013

Raspberry Pi Wobbulator - Conceptual Design

The basic configuration of a “conventional” wobbulator is shown below. The wobbulator generates a “saw-tooth” waveform which is used as the control input voltage for a Voltage Controlled Oscillator (VCO) and also as the external trigger voltage to control the time base (X direction)on the oscilloscope. The swept frequency output from the VCO is injected into the circuit under test and the resulting output is fed (via a detector circuit if necessary) to the Y axis input on the Oscilloscope. The resulting trace on the Oscilloscope shows the response of the circuit under test over the range of frequencies.


The Raspberry Pi Wobbulator achieves the same result by using a Direct Digital Synthesiser (DDS) module to generate the frequency sweep and an Analogue to Digital Converter (ADC) module to “measure” the response of the circuit under test. The DDS and ADC modules are controlled by and communicate with the software running on the Raspberry Pi via a Graphical User Interface (GUI) and the resulting frequency response curve of the circuit under test is be plotted by the software and displayed on the GUI.


The Raspberry Pi Wobbulator offers the following advantages over a conventional wobbulator.

  • Easy to use
  • Multiple ADC input channels available
  • Precise control of frequency sweep limits and sweep rate
  • Allows very slow sweep rates to be used (important for testing some kinds of RF filters)
  • No need for a VCO
  • No Need for an Oscilloscope
  • Inexpensive to Build
The Raspberry Pi Wobbulator was developed on a Raspberry Pi Model B Rev 2 (512 MB RAM) running the Raspbian “Wheezy” v7.1 (Linux kernel v3.6.11+) operating system.

In my next post I'll explain how the Raspberry Pi is connected to the DDS module in order to generate the RF frequency sweep.

Thursday 17 October 2013

Raspberry Pi Wobbulator - An Introduction

I know that I've been silent for a while, but with good reason....

I have been developing the Raspberry Pi Wobbulator, also known as the Raspberry Pi Sweep Generator & Measurement Device. A wobbulator (or sweep generator) is a piece of test equipment which is used in conjunction with an Oscilloscope to measure the frequency response characteristics of a circuit. It uses a “ramp” or “sawtooth” function generator connected to a Voltage Controlled Oscillator (VCO) to produce an output sweep over a defined range of frequencies. The response characteristics of the circuit under test can then be displayed on an Oscilloscope. A wobbulator is a useful tool for aligning the intermediate frequency (IF) stages of superhet receivers, but can also be used to measure the frequency response characteristics of RF filters and other circuits.

The RPi Wobbulator implements the functionality of a conventional wobbulator by using a Raspberry Pi, a Direct Digital Synthesiser (DDS) module and an Analogue to Digital Converter (ADC) module. The Raspberry Pi’s General Purpose Input Output (GPIO) interface is programmed to control the DDS module to generate the frequency sweep and to communicate with the ADC module to measure the response of the circuit under test. The Graphical User Interface (GUI) allows the user to choose the parameters for the frequency sweep and also displays the results.

The completed Raspberry Pi Wobbulator prototype is shown below.


The Raspberry Pi Wobbulator was designed and built as my entry into the RSGB Centenary Construction Competition. One of the conditions of entry into the competition was that the work must not have been already published - hence the reason for my recent silence. Anyway, I'm very pleased to say that my entry won the "Pi Users" category! Here is a photo of "yours truly" receiving my prize from none other than Raspberry Pi Foundation founder and overall visionary Eben Upton (he's the good looking one on the left) at the RSGB's Centenary Convention last weekend.


Full details of the design of the Raspberry Pi Wobbulator's hardware and software will be revealed very shortly, so please "stay tuned"!